Weather Alerts & Forecast
Live watches and warnings from the National Weather Service for Southport.
Next few days
Tinted cards mean a chance of rougher weather — some, more, severe.
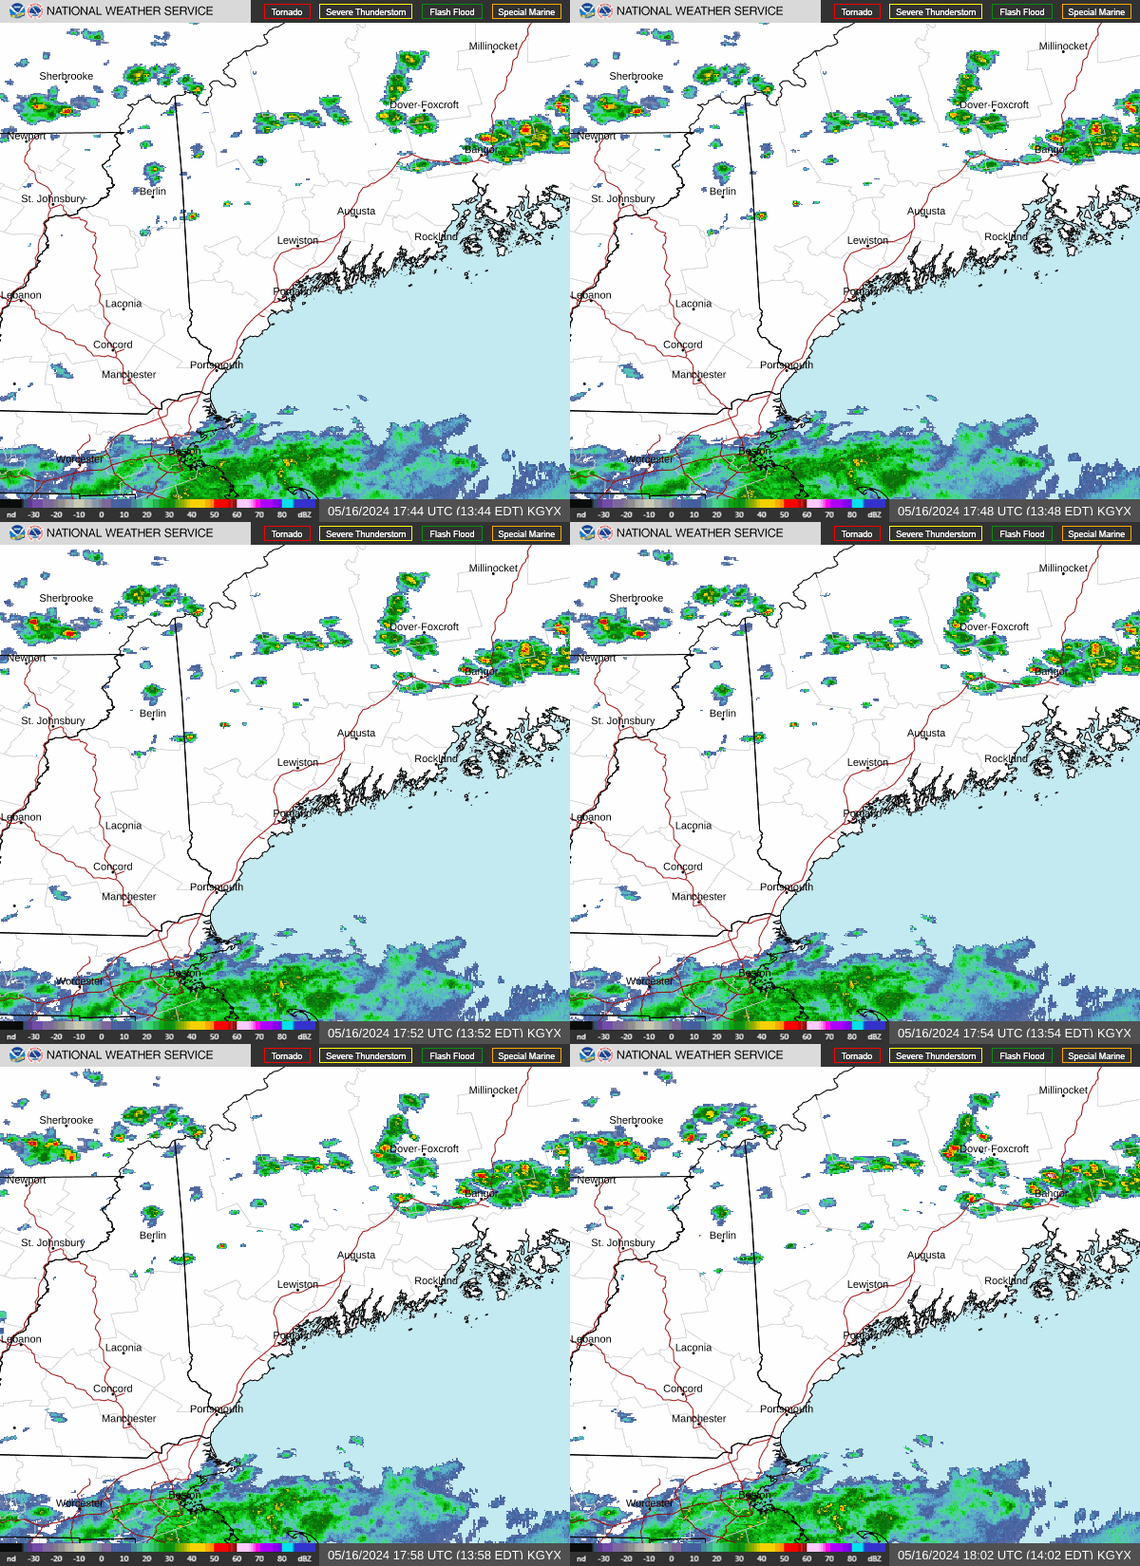
Live radar
Power Outages
Live outage numbers straight from Central Maine Power's public data, updated every 15 minutes.
No power and no internet? Call CMP at 1-800-696-3848 to report an outage by phone. Better yet, print the emergency fridge card now, while the lights are on.
Seas & Wind
Wind, seas, and wave heights for the coastal waters off Southport (Port Clyde to Cape Elizabeth, out 25 nautical miles).
Conditions ahead
Tinted cards mean a chance of rougher seas — some, more, severe.
Tides at Southport (Townsend Gut)
Next 24 hours
High and low tide predictions in feet at Southport.
Live wind & wave map
Wildfire Risk
The Maine Forest Service rates fire danger daily during fire season (late March–late November): Low, Moderate, High, Very High, or Extreme. At Very High or Extreme, burn permits are often suspended — check the map below before burning brush or lighting a campfire.
- Low
- Moderate
- High
- Very High
- Extreme
- Snow Cover
Outside of fire season this map may be blank or inactive. To report a wildfire or unattended smoke at any time of year, call 911.
Mosquitoes & Ticks
Estimated activity for today and the next two days, computed from the National Weather Service forecast for Southport plus the time of year. These are weather-based estimates, not measurements — treat them as a reason to grab the repellent or do a tick check, not as a guarantee either way.
Ticks in Maine can be active on any day above about 40°F, and mosquitoes can bite on days rated Low. A low estimate is never a reason to skip precautions during a walk in tall grass or brush.
How these estimates work — and how well
Each meter combines today's hourly forecast (temperature, humidity, and wind) with the seasonal calendar for Midcoast Maine. Mosquitoes are scored on the dusk hours, when they bite most; ticks on the daytime hours. Temperature sets the ceiling, and dry air or wind pulls the estimate down. The seasonal calendar follows the deer tick life cycle — the April–July nymph peak (when most Lyme transmission happens) and the October–November adult season — and the June–August mosquito peak.
What we checked: ten seasonal scenarios (January cold snap, July heat wave, a breezy dry summer day, mild October afternoon, and so on) were run through the model and compared against standard vector-ecology guidance — all ten land in the expected range. An earlier version failed this test and was corrected before publishing. On the day this was built, a live comparison against AccuWeather's mosquito index for Boothbay Harbor came out one notch apart in the same direction (theirs High, ours Very High) — expect this meter to run slightly hot on humid summer days.
What this can't tell you: weather is only part of the story. These estimates know nothing about actual insect populations near your house — standing water, deer traffic, leaf litter, or how wet the past month was all matter and aren't in the model. For real surveillance, use the sources below.
The real data
-
Today's Mosquito Forecast (Boothbay Harbor) ↗
A daily mosquito activity index for our area from AccuWeather, rated Low to Extreme based on recent weather.
-
30-Day Tick Disease Forecast Maps ↗
County-level Lyme and tick-borne disease forecasts from the Companion Animal Parasite Council, built from real veterinary test data. Written for pet owners, but where dogs are picking up ticks, people are too.
-
UMaine Tick Lab ↗
Identify any tick you find, see town-by-town tick data, and mail a tick in for disease testing (a few dollars, results in days).
-
URI TickEncounter ↗
Tick photo ID, seasonal activity by life stage, and prevention guidance from the University of Rhode Island.
-
Maine CDC: Mosquito-Borne Illness ↗
Seasonal updates on EEE and West Nile activity in Maine, plus prevention basics — dump standing water, use repellent at dusk.
-
MaineTracking: Lyme Disease Data ↗
Lyme case rates by town and county — see how Lincoln County compares and how the trend is moving.
Long-Term Climate Risk
How a changing climate touches life on Southport — the water around us, the water under us, and the pests our milder winters invite.
Rising seas & flooding
The map shows in red which parts of the island would be below water level — use the slider to see how the picture changes as the water rises.
-
Lincoln County Regional Planning Commission Resource Hub ↗
Local maps and studies for Lincoln County, including Southport — flood risk, sea level rise, and community resilience planning.
-
Maine Geological Survey: Sea Level Rise / Storm Surge Maps ↗
State maps showing how far inland flooding could reach under several sea-level-rise scenarios.
-
NOAA Sea Level Rise Viewer ↗
National tool with updated Maine elevation data; good for comparing Southport to nearby towns.
Drought & your well
Most Southport homes are on private wells, and dry summers are becoming more common. This map shows current drought conditions in Maine — it updates every Thursday.

-
Maine Drought Task Force ↗
State drought updates — and the place to report a dry well, which helps Maine track where help is needed.
-
Maine CDC: Private Well Water ↗
Private wells aren't regulated — testing is up to you. Test for bacteria and nitrates yearly, and arsenic, radon, and uranium every 3–5 years.
-
UMaine Extension: Well Water ↗
Plain-language guidance on testing, treating, and protecting your well — including what to do if it runs low.